Know how your business is really running.
The blue dot is not an insight.
It’s just a starting point.
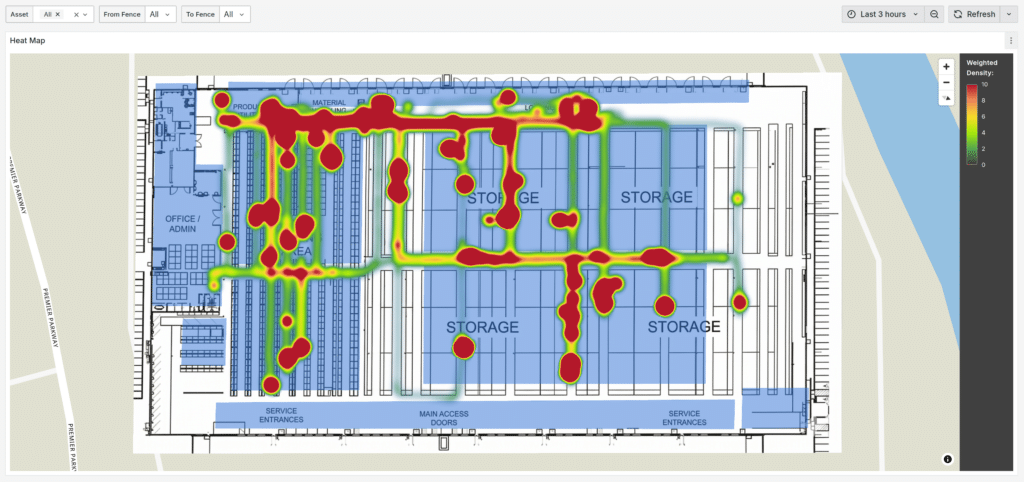
Heat Maps
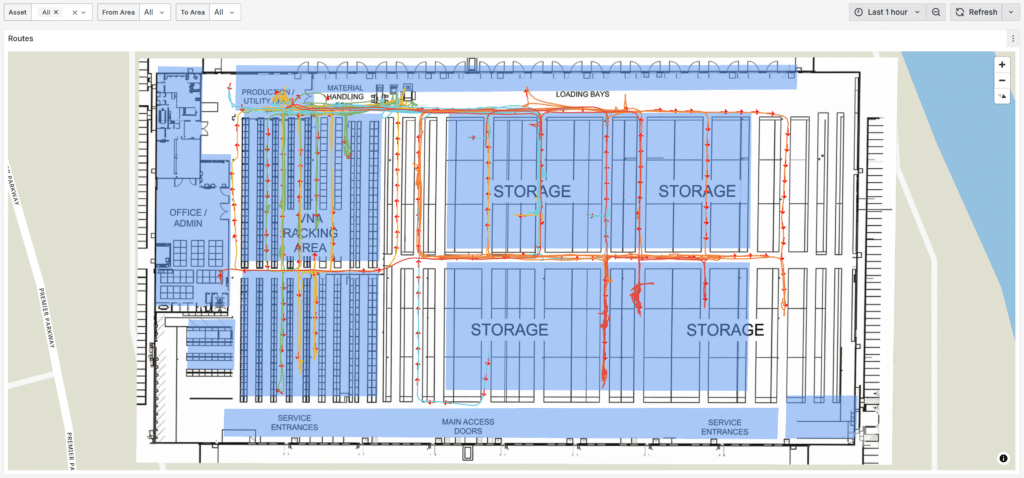
Spaghetti Diagram
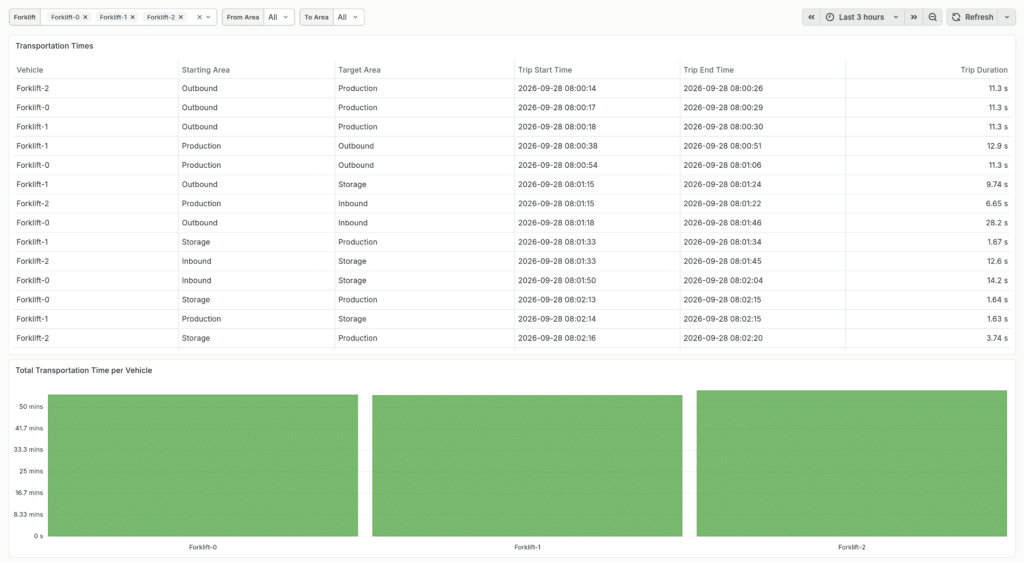
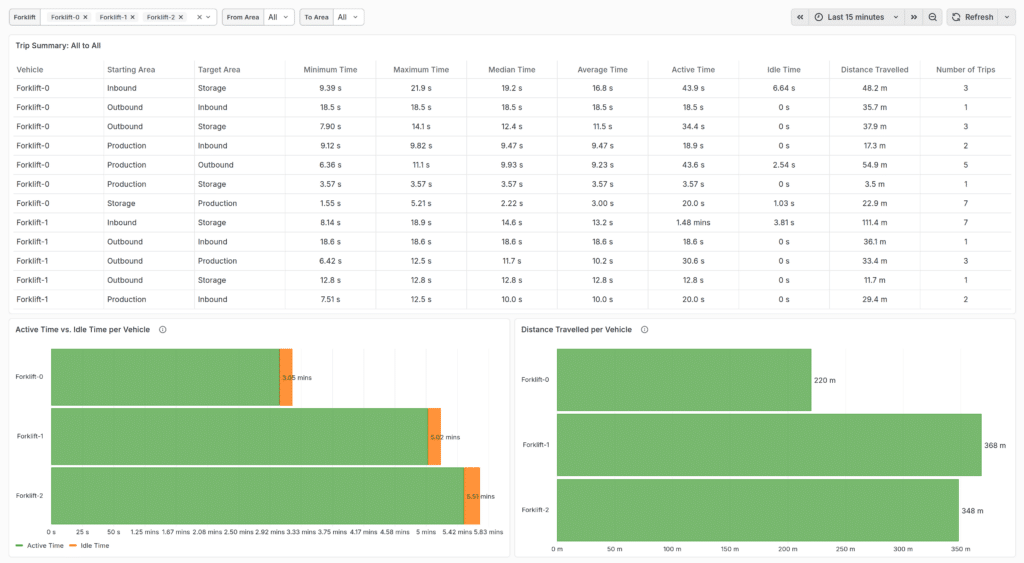
Transportation Times
How long materials spend moving between key operational areas.
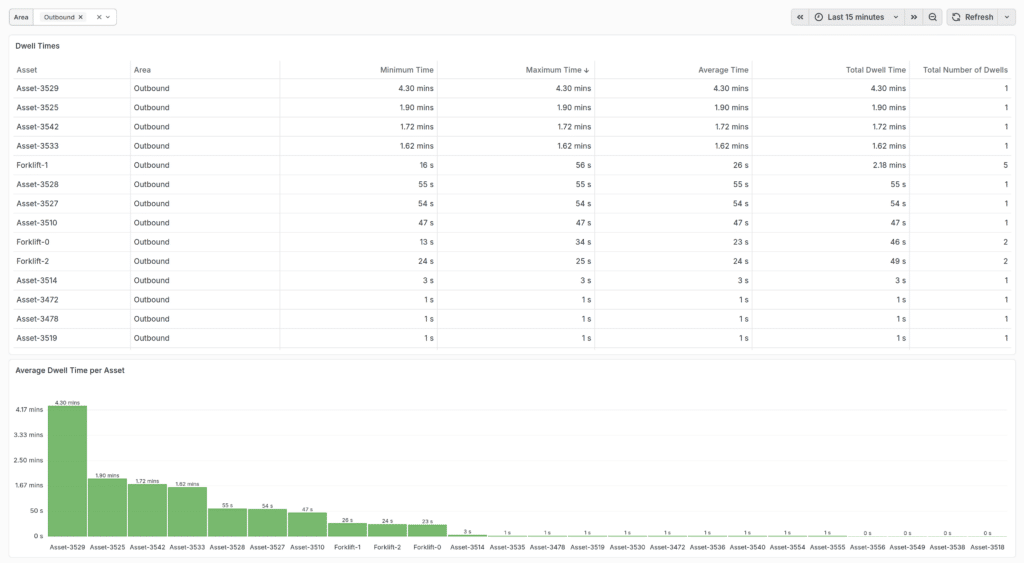
Dwell Times
How long materials spend within key operational areas.
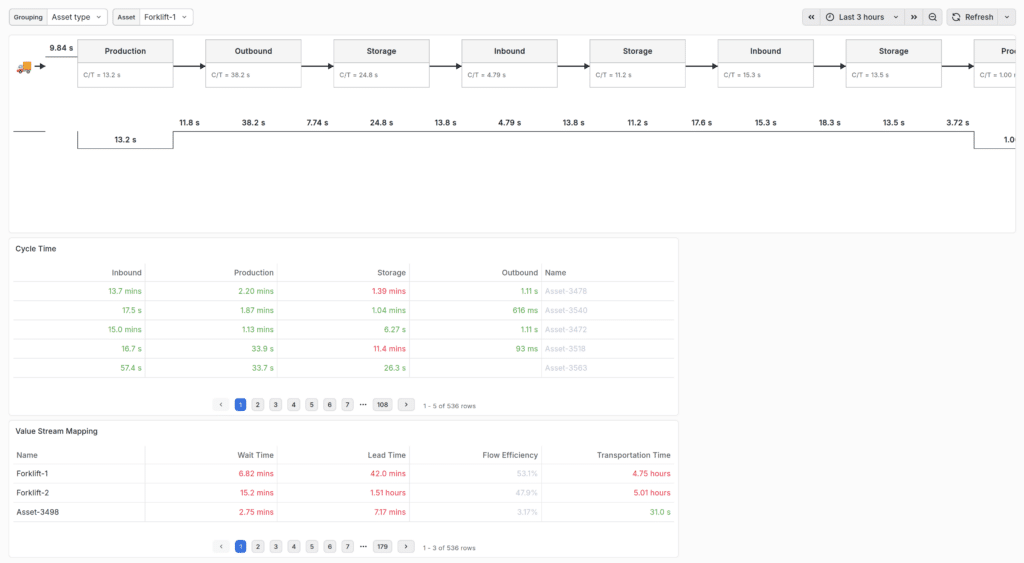
Value Stream Mapping
How a batch flows through production, start to finish.
Utilization Insights
How much of your capacity is really used, by area and by asset group.
Different role.
Different question.
Same answer.
Whoever’s asking — ops, safety, or production — DeepHub® Analytics already has the data to answer it.
Which operational areas should be improved?
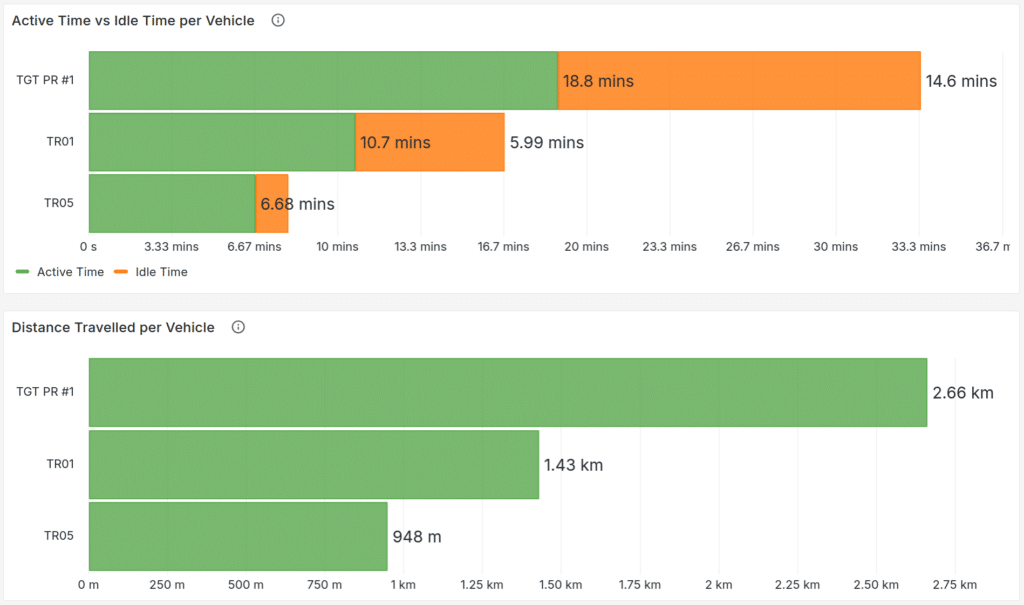
DeepHub® Analytics shows throughput from end to end. Zones are ranked by the delay they cause. Every fleet decision rests on real utilization figures.
Anecdote, or audit trail?
DeepHub® Analytics documents hotspots. A dwell time record per zone holds up in an audit. The movements before an incident can be replayed.
Do you have full visibility of your processes?
DeepHub® Analytics follows a batch through every stage. Station problems are separated from handling problems. A completed routing can be confirmed.
Plug into DeepHub® and go live.
Turn movement data into a digital twin of how your facility runs. Evidence for decisions, not assumptions.
Hosted, managed, ready on day one.
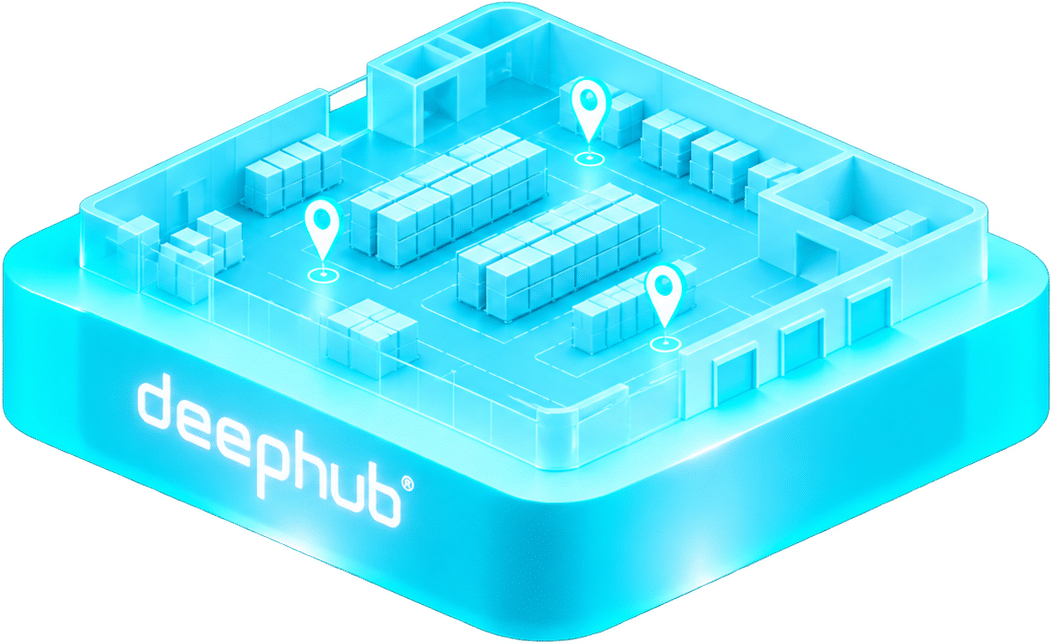
DeepHub® Analytics
Stores the spatial model and translates it into analytical maps, tables, and KPIs.
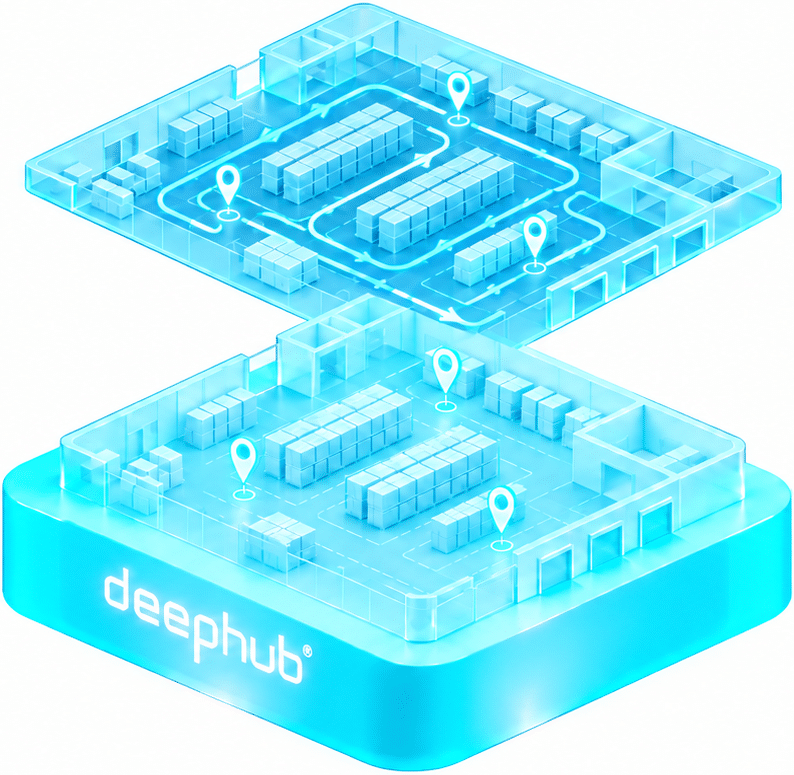
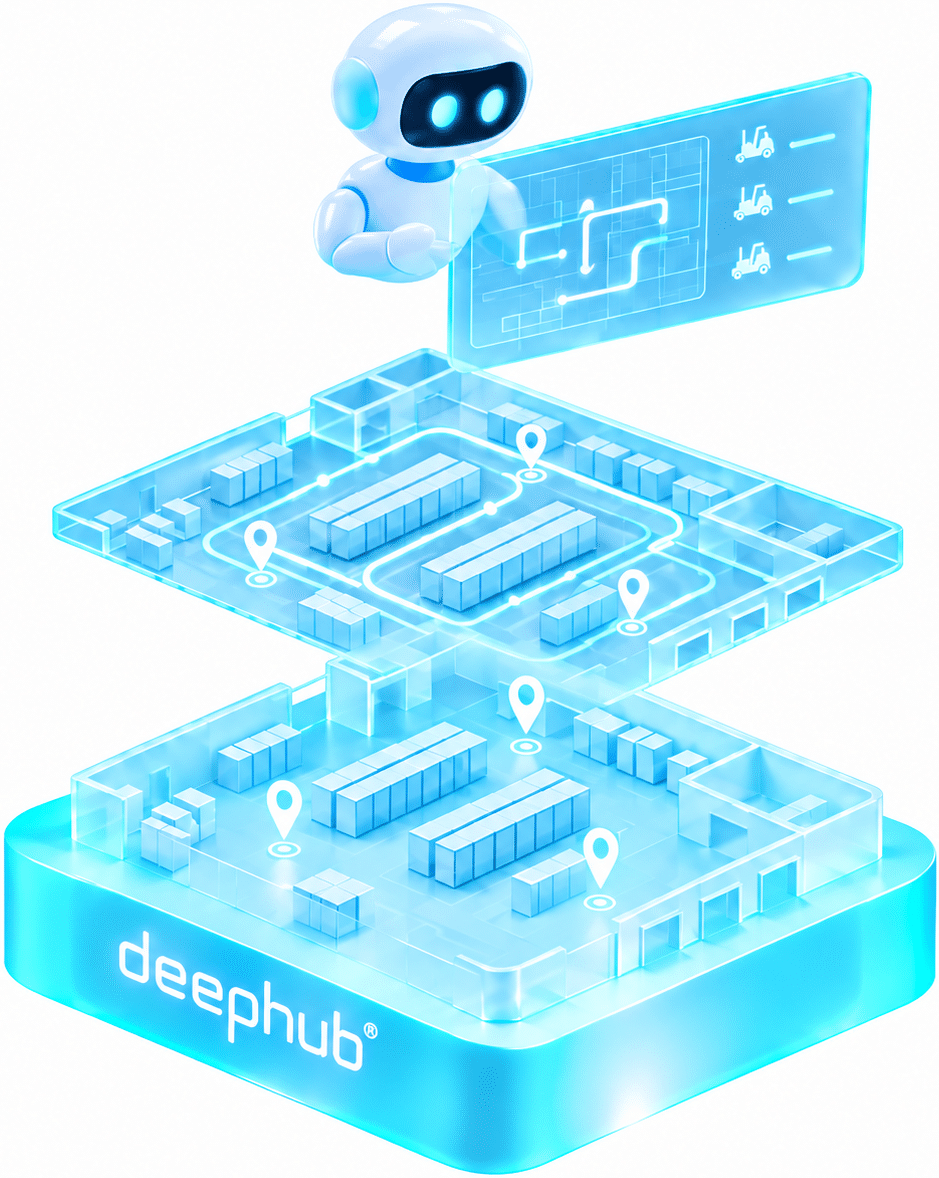
DeepHub® Agents
Enables you to deploy autonomous agents based on insights gained through DeepHub® Analytics.